Welcome to my giant post of 2022 reading stats! It's actually been a while since I did a yearly wrap up because I can't seem to keep a computer alive for an entire year. They keep dying and taking my spreadsheets with them! (Of course I don't back up my junk. I'm not that responsible.)
Anyway, 2022 was my worst reading year in recorded history. I usually read around 100 books a year, but in 2022, I read a grand total of 62. I think I was just busier than normal. My dog got sick in September 2021 and then needed increasing amounts of attention until she died in April 2022. The day after she died, I switched roles at work. (With 4 days' notice that the switch was happening.) My new role is infinitely more stressful. I worked a zillion hours of overtime. I caught COVID and several other diseases. I ran/walked over 1000 miles. I joined a boxing gym. My roommate is a 3-year-old child. Yeah . . . books haven't been a priority for a long time.
Even though I wasn't reading very much, the blog did okay. It passed one million all-time pageviews. I woke up at 3 in the morning to get this sweet screenshot.
Okay. Enough blathering. Let's make graphs. I mostly make these graphs because I like to see how my reading changes from year to year. I don’t know how interesting the graphs will be to people who aren't me, but I decorated them for you! Maybe that will help.
If you’re the kind of nerd who wants to know more about my reading year, check out my favorite books of 2022.
✅ 2022 Reading Statistics 📈
2022 Quick Facts
Total number of books finished: 62
Total number of rereads: 2
Total pages read: 23,324
Average pages read per day: 64
Number of books given up on (DNF): 1
Number of translations read: 4
Number of pageviews the blog got in 2022: 207,746
Average pageviews per day: 569
Number of new comments left: Approx. 1,800
Stats From Goodreads
Pie Charts From My Ridiculous Spreadsheets
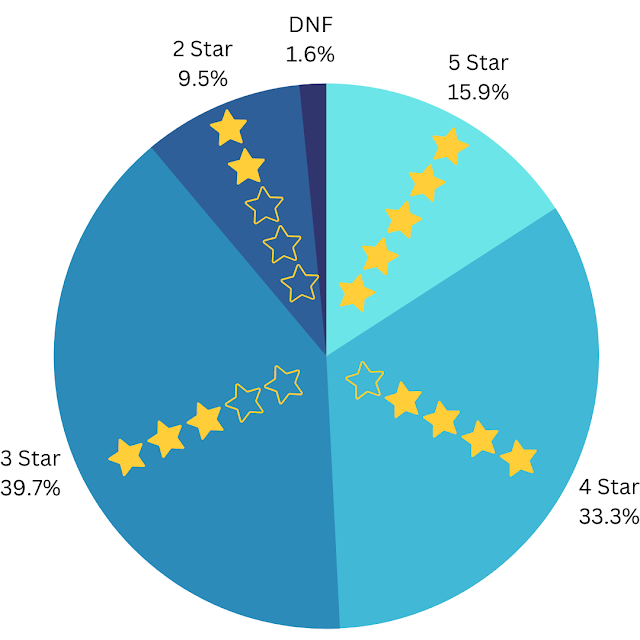 |
4 stars = above average
3 stars = average
2 stars = below average
DNF = did not finish. Quit to save my own sanity. |
Analysis: No 1-star books! In the past few years, I've been giving up on books rather than pushing through and then rating them 1 star. Life is too short for 1-star books. Now I need to get better at DNFing the 2-star books. I have too much hope that they'll improve if I keep reading. They rarely do.
Genre
Analysis: I really like novels. Fiction is my thing. There's not much to say about this graph except I'd like to read more nonfiction. I love it while I'm reading it, but I'm rarely motivated to pick it up.
Decade Published
Analysis: The graph of shame! Remember when I used to read a ton of classics like a pretentious asshat? I miss being a pretentious asshat. Most of the books I read last year were published in the 2010s because those books are cheap and easy to find. I'm finally reading the books that everybody was raving about in 2017! I would like to get back to reading classics. Those are also cheap and easy to find. I have no excuses.
Target Audience
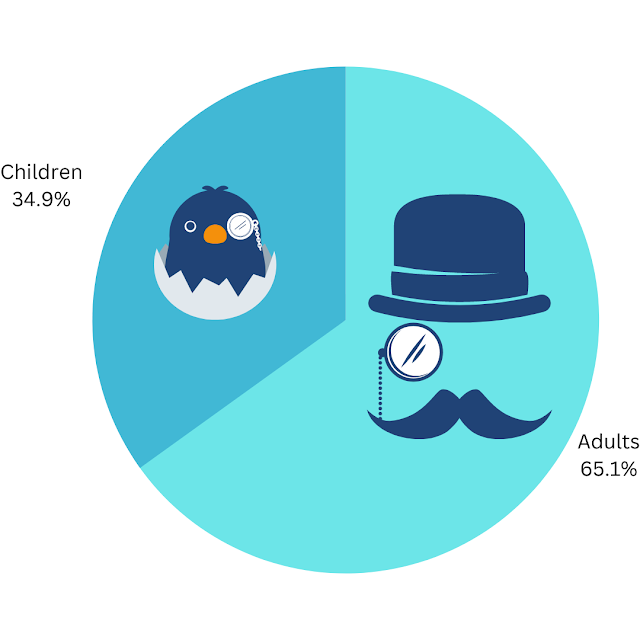 |
| "Children" includes young adult books |
Analysis: I didn't log the infinity picture books I read to Baby Brooklyn last year. This graph would look a lot different if I counted picture books. As you can tell by the decorations on the graph, I'm a very serious grownup, so it's not surprising that I mostly pick up adult books for myself.
Publisher
Analysis: Penguin Random House has always been my favorite publisher. I have no idea why. Am I drawn to their books? Do they just publish a ton of stuff? Are they better at promoting their products than other publishers? Are their books easier to find? It’s a mystery. I don't know why I like them.
Where Did All My Money Go?
Sources Of Books I Read In 2022
Analysis: This graph only shows the books I read in 2022, not the books I bought and stuck on my TBR shelf. In past years, I had a bad habit of buying books and then ignoring them and reading library books instead. I cured my library addiction last year. 85.7% of the books I read were bought with my own money.
Sources Of Books I Added To My TBR Shelf In 2022
Analysis: No Walmart. No Target. No grocery store or Amazon. The hipsters would be so proud of me! When I had money to spend on brand-new books, I ordered them from indie bookstores. I'm also obsessed with used bookstores and library sales. In 2022, I acquired 61 books and spent $403.50. That's about $6.61 per book. I read 28 of the 61 books I acquired. The rest are still sitting on my TBR shelf.
I checked out library books in 2022, but I don't track them on this spreadsheet because they never make it to the TBR shelf. I either read them right away or return them unread. Books from the Little Free Library are different because I can keep those forever if I want.
I Still Need Diverse Books
Diversity?
Analysis: There's not much to say about this one because I seek out books that will end up in the "Yes" category. I guess I'm doing an okay job of finding diverse books.
This graph only tracks the presence of a diverse cast of characters. It doesn't track the accuracy of the representation. Here's how a book ends up in the "Yes" category:
It’s #OwnVoices
And/Or
It’s a work in translation
And/Or
It features a point-of-view character who is a member of a minority community
And/Or
It discusses issues that disproportionately impact minority communities
Author Birth Continent
Analysis: Every year I say I'm going to fix this, and every year I don't. Why is it so hard for me to read books by people who aren't from North America? I need to try harder to find translated books. I think that's the problem. I'm too lazy to do the research.
Author Gender
Analysis: I always read more female authors than male, but my graphs have never been this lopsided before. It's usually closer to 50/50. I have no idea what happened. It wasn't intentional. It probably happened because I'm a woman and books about women are more appealing and relevant to my life. I don't know.
Book Settings
Analysis: Sam @ We Live And Breathe Books inspired me to add a setting column to my spreadsheet last year. I've never tracked settings before. I'm surprised at how many books involve road trips or international travel. I guess I'm the only person who never goes anywhere. Even 22.2% of fictional people get to go on vacation!
But What States, Tho?
Analysis: I read a lot of books set in the US, so I decided to find the most popular places for fictional people to live. I chucked all the road trip books out of my data and only looked at books where the characters stay in one state. The most popular states for fictional people are New York, California, Georgia, and Massachusetts. I guess that makes sense. A lot of nonfiction people live in those places too. They're all states with large populations.
Who Are You People? (Blog Stats)
How Did You Find This Place?
Analysis: How do people find this blog? Apparently, most of them come from Pinterest. That doesn't surprise me because I'm a Pinterest ho who spends my life obsessing over my boards. (Please follow me on Pinterest; I crave attention.)
"The Void" is hundreds of blogs and random websites that each drive >1% of the traffic. I have no idea how to represent those on a graph without it looking stressfully messy. I'm not a graph scientist.
Where Do You Live?
Analysis: This is not surprising. I blog in English and talk about books that are (mostly) published in the USA. Of course I'm going to attract Americans.
Shout out to the proud residents of The Void. It's made up of a bunch of different countries that each generate >1% of the blog's traffic. I appreciate you, Void!
The 2022 Posts You Clicked The Most
Best 2022 Book Releases
Books With Villains As Main Characters
Best 2022 Young Adult Book Releases
Best 2022 Middle Grade Book Releases
January 2022 Book Haul
Modern Books That Will Become Classics
Will I Give These Books 5 Stars?
Atmospheric Fall Books
Best Books Of 2022 (So Far)
Did These Popular Books Live Up To The Hype?
Wow, you survived. That was a lot of scrolling. Do you keep a reading spreadsheet or make graphs for your reading year?


I know Red White & Royal Blue has been popular for a couple years but seeing that it's been shelved by 1.5 M people is pretty staggering. Hooray for no 1-star reads. Now to weed out (or DNF) the 2-stars, too. :)
ReplyDeleteFor how busy your life sounds, I think you did great on the number of books you read. The 3-year-old in my life is my granddaughter and I babysit her 2x a week...those are the days I read the least. Also, I love reading graphs so I appreciate this post.
ReplyDeleteI love graphs, especially animated ones, so this was a fun post. Also, I can now proudly proclaim I live in The Void, so my week has been made ;)
ReplyDeleteYou had some interesting stats. I track setting, but never analyzed it. I am not surprised to see CA and NY dominating. I feel like I am always reading books set there. I am proud of you for DNFing though 1.6 percent is a low number. I may see what mine came out to be. There were weeks where I DNFed 2 or more books. Great job with the graphs. Better question - how did your page count compare to last year? I know you mentioned reading some chunky books. They take longer.
ReplyDeleteLOVE this post! I wish I could do interesting things like this, so I wil live vicarously through you.
ReplyDeleteI love reading all your stats! I'm so sorry about your dog.
ReplyDeleteOh my gosh, I LOVE all your charts and graphs! And the icons you added just made me smile. Now you've got me thinking about my blog statistics and I am going to look and add mine to my next Sunday post.
ReplyDeleteWow, this is impressive! I think 62 books is an amazing amount of books; I know how busy you were with work during the summer. I also tend to read a majority of female authors, and I also did not count the picture books I read with Henry, or else my totals would also be a lot higher! (I did start a Goodreads account for him, though!)
ReplyDeleteI liked all of your graphs. Interesting for you to analyze. Like you, I primarily read female fiction in 2022. Perhaps I will get a bit better this year so it won't be so lopsided. I'm sad your dog passed away. That's so hard. ugh. Do you think you'll get another dog? Enjoy your week.
ReplyDeleteWOW, I thought I did a lot of work in my review of 2022 reading! This is amazing. I have no idea how much money I spent, etc. As I did point out, I tend to read men but my favorite book of the year was by a woman.
ReplyDeleteI'm too lazy to put together a detailed stats page like this, but I absolutely love seeing it when other people put them together. Your stats are fascinating and very impressive that your blog has hit over a million page views. I'm so sorry to hear about your dog though.
ReplyDeleteLove all the stats!! I’m with you at trying to get better about DNFing books that I don’t enjoy. There are just too many books out there that are calling my name 😂 I adopted the policy of “if I can’t rate it higher than 3 stars” or “if I wouldn’t purchase as a gift for someone” than I abandon the book.
ReplyDelete"The Void" sounds so cool. Kinda wish I was from the Void.
ReplyDeleteYour stats post is impressive!!! I read but rarely manage to keep any data updated either on spreadsheets I download for book bloggers or even on Goodreads or other such sites.. And now I am inspired but not sure if I can muster enough energy to do what you have done ....
ReplyDeleteLove the post and following you on Pinterest now.
I really really wish I was motivated enough to do something like this, because I love reading other people's, and they are so fun to look at- and I imagine, to compare year after year. Unfortunately, I am simply not that person. Like I'm lucky these bad boys get reviewed on time, you know? Truly, if I reviewed less and posted more fun stuff (someday, maybe), then I would be able to do more cool stuff. This is a personal failing. Anyway, I think I read far more books by women too- again, this is why spreadsheets would come in handy! You also have me curious about my diversity breakdown. Also, do you want to know how many books I read in 2022 that were published in 2022? I think all but... two maybe? Well- and technically the dozen or so from 2023. It's a REAL problem. (I double checked and it was in fact exactly two. Out of 158. Honestly, send help.)
ReplyDeleteInteresting. What no books from Colorado or Minnesota or North Carolina?
ReplyDeleteAnne - Books of My Heart
Wow, that's a lot of graphs! I found most of them really interesting. It would be fun to see how they compare from year to year, too.
ReplyDeleteI'm also curious how you made the graphs and charts, especially with the animations. And you track a lot of stuff on your spreadsheets! I don't track quite that much, though I do track genre, target age, author demographic info, diversity of main and important secondary characters in the book, publisher, date first published, where I got it, and stuff like that. I would like to produce nice charts like you have, but I haven't figured out how yet. Someday...
By the way, I switched to using Google Sheets for my book-reading data, so I didn't have to worry about backups or losing data, and I can access them from my phone if I want to. Not that I do, but I could. It's something to consider, though I don't think Google Sheets is quite as versatile or powerful as, say, Excel.
Finally, I hear you regarding wishing you were reading more classics and other books from earlier than the 2010s. The more time I spend immersed in the online reading community, be it blogs or Instagram, the more brand-new books I seem to read. I would like to read more classics, too -- not the depressing ones, but authors like Austen and Gaskill. I would also like to read more classic mysteries and even children's books. (I can't believe I have never read E. Nesbit. Seriously, what is wrong with me?)
So cool! I also make crazy stats and charts and pie, but far from vute as yours! (what tool do you use??): https://wordsandpeace.com/2023/01/05/year-of-reading-2022-part-2-statistics/
ReplyDeleteWow! It's amazing to me how much of your traffic comes from Pinterest, even though I knew how much you work on your boards. Very impressive! I absolutely love all these charts and graphs. Mine are coming soon!
ReplyDeleteNicole @ Feed Your Fiction Addiction